
Page 27 - AA 2023 Year Book Website
P. 27
Egypt
also help fish products retain their natural making it more efficient, sustainable and ability of fish production by monitoring
flavors and aromas. The use of these ad- healthier for everyone involved,” Wakileh and controlling water quality, tempera-
ditives also contributes to the reduction explained. ture, oxygen levels and other parameters
of environmental impacts and harmful ef- There is enormous potential in explor- in real-time. AI-powered aquaculture
fects of climate change. ing new possibilities with AI-powered systems can also help reduce waste by
“Nanotechnology and ICT are allowing aquaculture systems, particularly IT ap- optimizing feed utilization and improv-
us to explore new possibilities with fish plications. This technology can be used to ing disease prevention strategies. When it
additives that were not possible previous- boost aquaculture output and efficiency comes to harnessing this technology for a
ly. These technologies are revolutionizing while minimizing environmental impact. It more efficient, sustainable and profitable
the way we think about food production, can also be used to improve the sustain- aquaculture sector, the possibilities are
limitless.
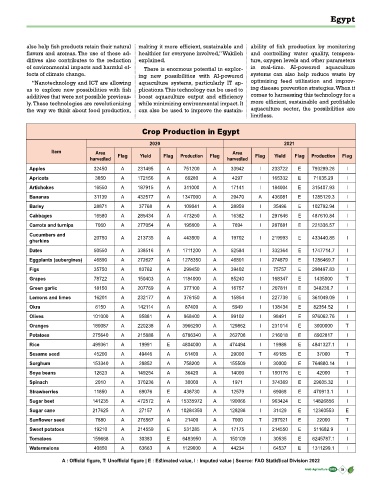
Crop Production in Egypt
2020 2021
Item Area Area
harvested Flag Yield Flag Production Flag harvested Flag Yield Flag Production Flag
Apples 32450 A 231495 A 751200 A 33942 I 233722 E 793299.26 I
Apricots 3850 A 172156 A 66280 A 4297 I 165332 E 71035.29 I
Artichokes 16550 A 187915 A 311000 A 17141 I 184004 E 315407.93 I
Bananas 31139 A 432577 A 1347000 A 29470 A 436081 E 1285129.3 I
Barley 28871 A 37768 A 109041 A 28959 I 35496 E 102792.94 I
Cabbages 16580 A 285434 A 473250 A 16382 I 297646 E 487610.84 I
Carrots and turnips 7060 A 277054 A 195600 A 7694 I 287681 E 221336.57 I
Cucumbers and 20750 A 213735 A 443500 A 19702 I 219993 E 433440.85 I
gherkins
Dates 50550 A 338516 A 1711200 A 52584 I 332364 E 1747714.7 I
Eggplants (aubergines) 46890 A 272627 A 1278350 A 46801 I 274879 E 1286469.7 I
Figs 35750 A 83762 A 299450 A 39402 I 75757 E 298497.83 I
Grapes 78722 A 150403 A 1184000 A 85240 I 168347 E 1435000 T
Green garlic 18150 A 207769 A 377100 A 16757 I 207811 E 348230.7 I
Lemons and limes 16201 A 232177 A 376150 A 15854 I 227739 E 361049.09 I
Okra 6150 A 142114 A 87400 A 5949 I 138434 E 82354.52 I
Olives 101000 A 95881 A 968400 A 99102 I 98491 E 976062.76 I
Oranges 180087 A 220238 A 3966200 A 129862 I 231014 E 3000000 T
Potatoes 275640 A 215688 A 6786340 A 262706 I 216018 E 6902817 I
Rice 499361 A 19991 E 4804000 A 474494 I 19988 E 4841327.1 I
Sesame seed 45200 A 49446 A 61400 A 29000 T 49185 E 37000 T
Sorghum 153340 A 28852 A 758200 A 155509 I 30000 E 764880.14 I
Soya beans 12623 A 149254 A 36420 A 14000 T 150176 E 42000 T
Spinach 2010 A 370236 A 30000 A 1971 I 374369 E 29605.32 I
Strawberries 11850 A 69076 E 438730 A 12579 I 69068 E 470913.1 I
Sugar beet 141235 A 472572 A 15335972 A 190066 I 963424 E 14826856 I
Sugar cane 217625 A 27157 A 10284350 A 128298 I 31429 E 12360553 E
Sunflower seed 7880 A 276567 A 21400 A 7000 T 297921 E 22000 T
Sweet potatoes 19210 A 214559 E 531285 A 17175 I 214550 E 511682.9 I
Tomatoes 159668 A 30383 E 6493950 A 150109 I 30535 E 6245787.1 I
Watermelons 40850 A 63663 A 1129000 A 44234 I 64537 E 1311299.1 I
A : Official figure, T: Unofficial figure | E : Estimated value, I : Imputed value | Source: FAO Statistical Division 2022
Arab Agriculture 2023 25